Pokemon Classification as Legendary or Nonlegendary
Legendary Pokemon have higher stats than Nonlegendary Pokemon. Therefore, it should be possible for a Machine Learning algorithm to classify
a Pokemon based on their stats. The biggest challenge for this classification problem should be differentiating Mega Evolutions from Legendary Pokemon, since both have higher stats than the average Pokemon.
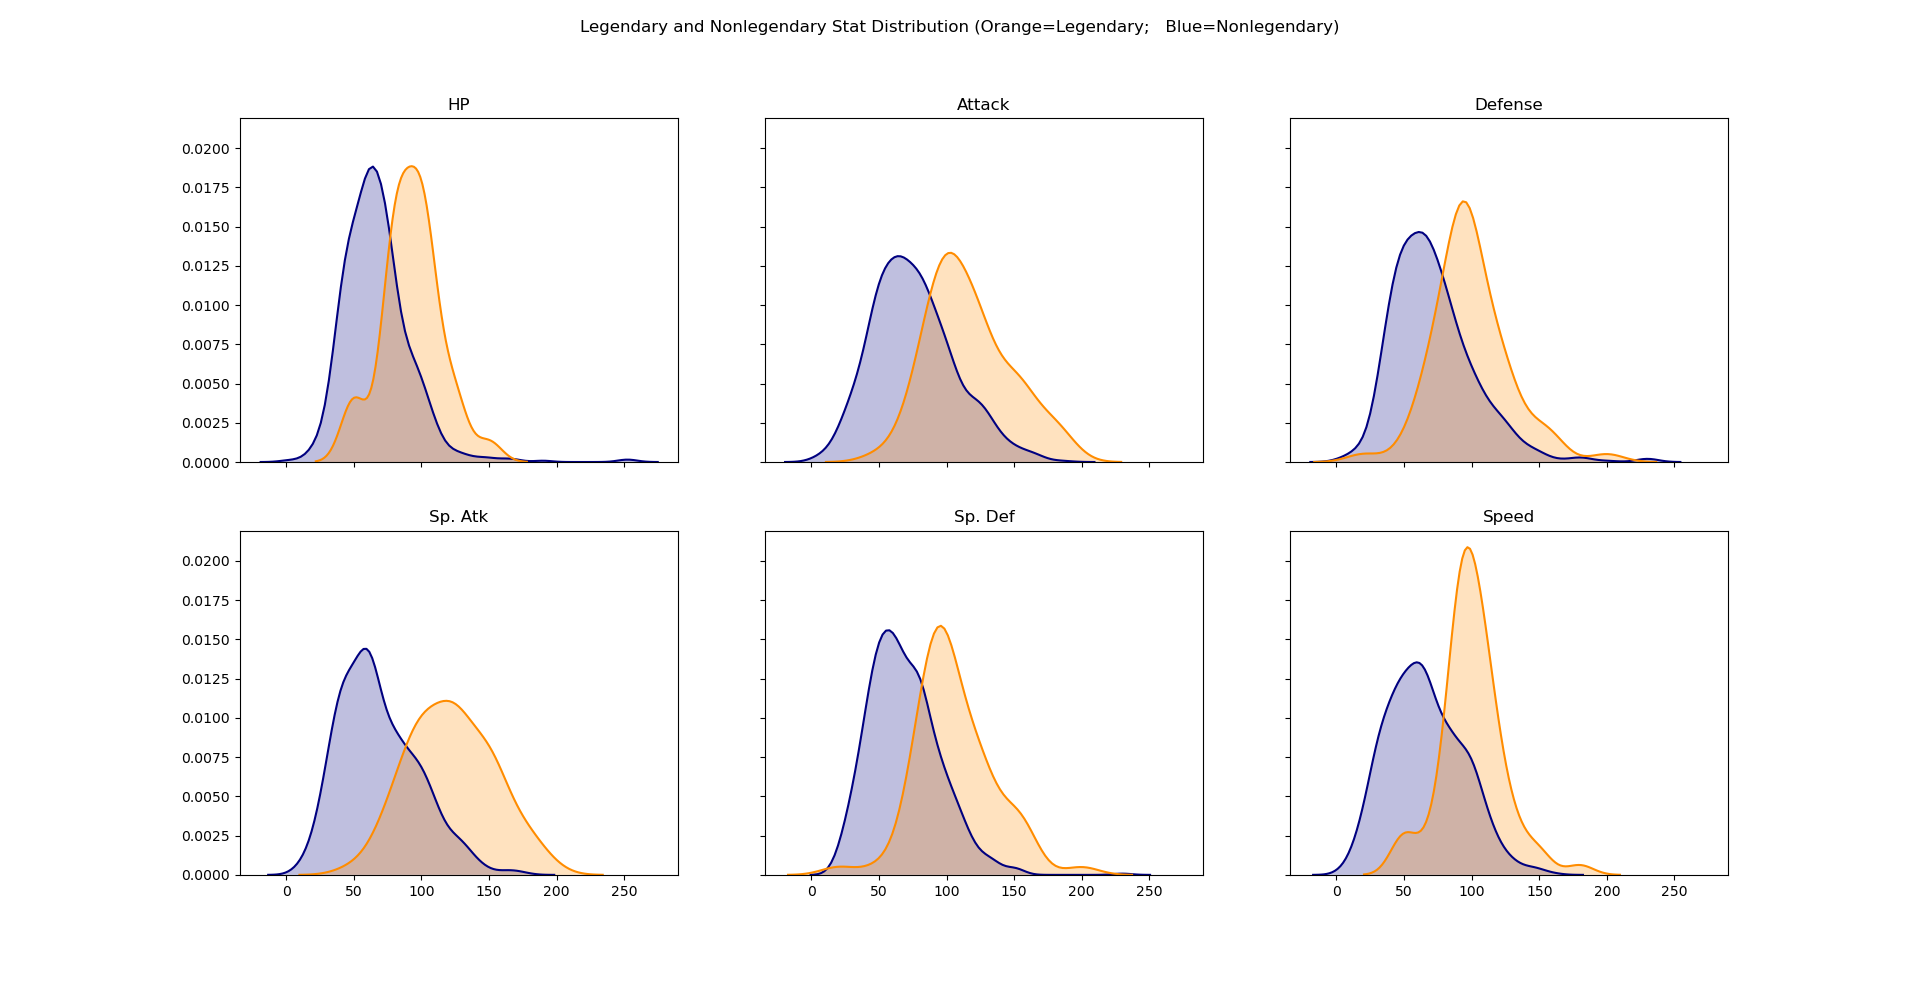
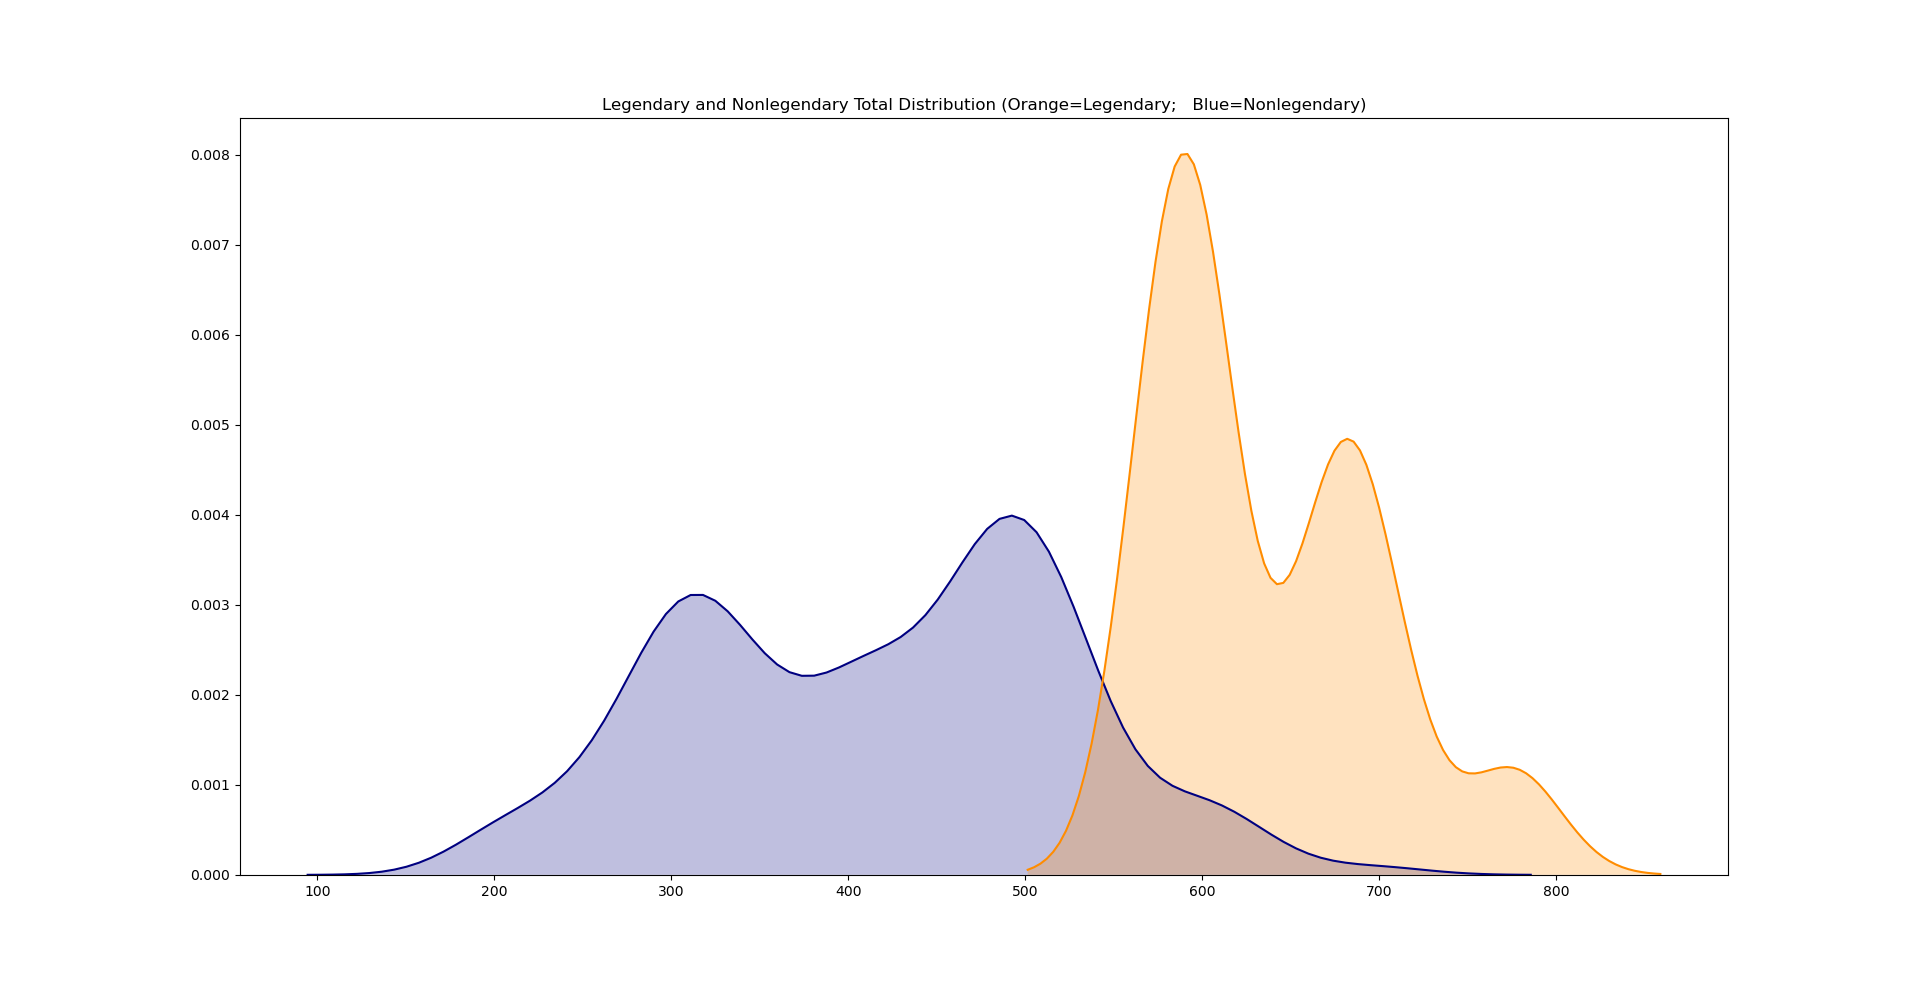
Probability Density Functions were generated to get a visual of how stats and totals differed between Legendary and Nonlegendary Pokemon.


Data Preprocessing
Pokedex # and Name were deemed to be useless features and were dropped. Instead of using Primary Type and Secondary Type, new boolean features 'is_TYPE' were created for all types. Furthermore, since Legendary Pokemon are stronger, it is possible that their Primary and Secondary Type are chosen in a way
to minimize weaknesses. For example: Normal Type Pokemon take increased damage from Fighting Type Pokemon, deal less damage to Rock and Steel Type Pokemon,
and deal no damage to Ghost Type Pokemon (and also take no damage from Ghost Type attacks) - since they do not deal increased damage to any type, 'Normal Type' is generally a disadvantage.
Following this hypothesis, 'dmg_from_TYPE' features were created (default value=1) and adjusted according to a Pokemon Weakness Chart.
Finally, the data was split into a training and testing set based on the Generation: Generations 1-5 composed the training set, and Generation 6 composed the testing set. This resulted in a 90-10 split , which is less ideal than a 80-20 split. However, since Legendary Pokemon are much rarer than Nonlegendary Pokemon, splitting by Generation seemed like a good way to have an realistic percentage of Legendary Pokemon in the testing set.
Random Tree Forest
No Specified Hyperparameters
| Confusion Matrix | |
|---|---|
| 74 | 0 |
| 6 | 2 |
| Precision | Recall | f1 Score | |
|---|---|---|---|
| False | 0.93 | 1.00 | 0.96 |
| True | 1.00 | 0.25 | 0.40 |
| Confusion Matrix | |
|---|---|
| 74 | 0 |
| 5 | 3 |
| Precision | Recall | f1 Score | |
|---|---|---|---|
| False | 0.94 | 1.00 | 0.97 |
| True | 1.00 | 0.38 | 0.55 |
While finetuning the hyperparameters only seem to provide a marginal improvement, in reality, going from 2 True Positives to 3 True Positives is an improvement of 50%. This is especially when considering the total amount of True Positives is only 8.
It seems the rtf model was a little too strict when choosing Legendary Pokemon, however it is still impressive that it did not classify any Mega Evolutions as Legendary Pokemon.
Logistic Regression
| Confusion Matrix | |
|---|---|
| 73 | 1 |
| 2 | 6 |
| Precision | Recall | f1 Score | |
|---|---|---|---|
| False | 0.97 | 0.99 | 0.98 |
| True | 0.86 | 0.75 | 0.80 |
The f1 Score indicates that this model performed better than the rtf, despite misclassifying a Nonlegendary Pokemon. It's worth noting that the default parameters for the model did not converge, and instead needed max_iter=7000 to be specified.
Support Vector Classification
With Base Features
| Confusion Matrix | |
|---|---|
| 73 | 1 |
| 4 | 4 |
| Precision | Recall | f1 Score | |
|---|---|---|---|
| False | 0.95 | 0.99 | 0.97 |
| True | 0.80 | 0.50 | 0.62 |
The f1 Score indicates that this model performed better than rtf, but worse than Logistic Regression. Moreover, finetuning the hyperparameters did not have an effect on performance (except for C=0.1). However, since SVM's are sensitive to scaling, the training set had to be standardized.
With Polynomial Features (degree=3)
| Confusion Matrix | |
|---|---|
| 64 | 10 |
| 3 | 5 |
| Precision | Recall | f1 Score | |
|---|---|---|---|
| False | 0.96 | 0.86 | 0.91 |
| True | 0.33 | 0.62 | 0.43 |
The f1 Score indicates that this model performed worse than all the other models. Tuning the hyperparameters did not help much. This indicates that adding polynomial features is not helpful for the model.
Since other models cannot use the kernel trick and because the results were so underwhelming, other models will not be fitted with polynomial features.
Ensemble Learning
Work in progress...